[et_pb_section fb_built=”1″ custom_padding_last_edited=”on|desktop” admin_label=”section” module_id=”blurbicon” _builder_version=”4.16″ background_color=”rgba(255,255,255,0)” background_image=”https://www.in8development.com/wp-content/uploads/2018/03/Artboard3x-1.png” custom_padding_tablet=”50px|0|50px|0″ custom_padding_phone=”” transparent_background=”on” padding_mobile=”off” global_colors_info=”{}”][et_pb_row admin_label=”row” _builder_version=”4.16″ background_size=”initial” background_position=”top_left” background_repeat=”repeat” global_colors_info=”{}”][et_pb_column type=”4_4″ _builder_version=”4.16″ custom_padding=”|||” global_colors_info=”{}” custom_padding__hover=”|||”][et_pb_blurb admin_label=”PAGE HEADER & ICON” _builder_version=”4.16″ header_level=”h2″ header_font=”|600||on|||||” header_font_size=”22px” background_size=”initial” background_position=”top_left” background_repeat=”repeat” text_orientation=”center” background_layout=”dark” max_width_tablet=”50px” use_border_color=”off” saved_tabs=”all” global_colors_info=”{}”]
IN8 SLATE IS A REVOLUTIONARY VISUAL INVESTIGATIVE APPLICATION THAT ENABLES YOU TO CONFIDENTLY TELL THE STORY OF THE INVESTIGATION
[/et_pb_blurb][/et_pb_column][/et_pb_row][/et_pb_section][et_pb_section fb_built=”1″ admin_label=”section” module_id=”blurbicon” _builder_version=”4.16″ background_color=”#ffffff” custom_padding=”54px|0px|0|0px” transparent_background=”off” global_colors_info=”{}”][et_pb_row column_structure=”1_3,1_3,1_3″ admin_label=”row” _builder_version=”4.16″ background_size=”initial” background_position=”top_left” background_repeat=”repeat” global_colors_info=”{}”][et_pb_column type=”1_3″ _builder_version=”4.16″ custom_padding=”|||” global_colors_info=”{}” custom_padding__hover=”|||”][et_pb_blurb title=”USERS” use_icon=”on” font_icon=”||divi||400″ icon_color=”#0078bd” image_icon_width=”50″ admin_label=”SERVICE 1″ _builder_version=”4.16″ background_size=”initial” background_position=”top_left” background_repeat=”repeat” text_orientation=”center” use_border_color=”off” icon_font_size=”50″ saved_tabs=”all” inline_fonts=”Open Sans” global_colors_info=”{}”]
Forensic accountants, private investigators, auditors, law enforcement, attorneys, and more.
[/et_pb_blurb][/et_pb_column][et_pb_column type=”1_3″ _builder_version=”4.16″ custom_padding=”|||” global_colors_info=”{}” custom_padding__hover=”|||”][et_pb_blurb title=”EVIDENCE MANAGEMENT” use_icon=”on” font_icon=”||divi||400″ icon_color=”#0078bd” image_icon_width=”50″ admin_label=”SERVICE 2″ _builder_version=”4.16″ header_font=”Raleway||||” background_size=”initial” background_position=”top_left” background_repeat=”repeat” text_orientation=”center” use_border_color=”off” icon_font_size=”50″ saved_tabs=”all” global_colors_info=”{}”]
Import, analyze and manage evidence digitally, and produce reports that are easily understood.
[/et_pb_blurb][/et_pb_column][et_pb_column type=”1_3″ _builder_version=”4.16″ custom_padding=”|||” global_colors_info=”{}” custom_padding__hover=”|||”][et_pb_blurb title=”RELATIONSHIPS” use_icon=”on” font_icon=”||divi||400″ icon_color=”#0078bd” image_icon_width=”50″ admin_label=”SERVICE 3″ _builder_version=”4.16″ header_font=”Raleway||||” background_size=”initial” background_position=”top_left” background_repeat=”repeat” text_orientation=”center” use_border_color=”off” icon_font_size=”50″ global_colors_info=”{}”]
Create and define relationships with layers of information that help you better understand your data.
[/et_pb_blurb][/et_pb_column][/et_pb_row][et_pb_row _builder_version=”4.16″ global_colors_info=”{}”][et_pb_column type=”4_4″ _builder_version=”4.16″ global_colors_info=”{}”][et_pb_divider color=”#000000″ _builder_version=”4.16″ global_colors_info=”{}”][/et_pb_divider][/et_pb_column][/et_pb_row][et_pb_row _builder_version=”4.16″ background_size=”initial” background_position=”top_left” background_repeat=”repeat” module_alignment=”center” custom_padding=”27px|0|27px|0px” global_colors_info=”{}”][et_pb_column type=”4_4″ _builder_version=”4.16″ custom_padding=”|||” global_colors_info=”{}” custom_padding__hover=”|||”][et_pb_text _builder_version=”4.16″ header_2_font=”|600||on|||||” header_2_font_size=”20px” header_3_font=”|600|||||||” header_3_line_height=”1.1em” global_colors_info=”{}”]
We’re focused on empowering investigators to be more efficient and productive. Our USER-friendly application leverages modern technology AND INTUITIVE DESIGN to help users manage and make sense of investigative data AND EFFECTIVELY COMMUNICATE THE FACTS OF THE INVESTIGATION TO A HUMAN AUDIENCE
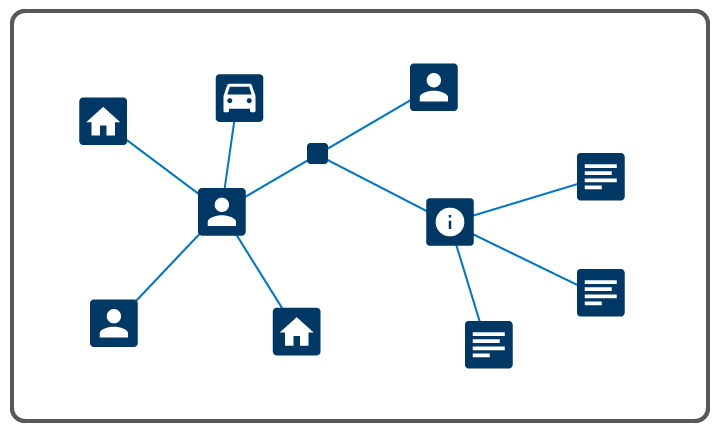
[/et_pb_text][/et_pb_column][/et_pb_row][et_pb_row _builder_version=”4.16″ global_colors_info=”{}”][et_pb_column type=”4_4″ _builder_version=”4.16″ global_colors_info=”{}”][et_pb_divider color=”#000000″ _builder_version=”4.16″ global_colors_info=”{}”][/et_pb_divider][/et_pb_column][/et_pb_row][/et_pb_section][et_pb_section fb_built=”1″ admin_label=”section” _builder_version=”4.16″ transparent_background=”off” global_colors_info=”{}”][et_pb_row column_structure=”1_4,3_4″ admin_label=”row” _builder_version=”4.16″ background_size=”initial” background_position=”top_left” background_repeat=”repeat” global_colors_info=”{}”][et_pb_column type=”1_4″ _builder_version=”4.16″ custom_padding=”|||” global_colors_info=”{}” custom_padding__hover=”|||”][et_pb_image src=”https://www.in8development.com/wp-content/uploads/2018/05/CanvasGraphic2.png” align_tablet=”center” align_phone=”” align_last_edited=”on|desktop” _builder_version=”4.16″ animation_style=”slide” animation_direction=”left” animation_duration=”500ms” animation_intensity_slide=”10%” global_colors_info=”{}”][/et_pb_image][/et_pb_column][et_pb_column type=”3_4″ _builder_version=”4.16″ custom_padding=”|||” global_colors_info=”{}” custom_padding__hover=”|||”][et_pb_text admin_label=”Canvas” _builder_version=”4.16″ background_size=”initial” background_position=”top_left” background_repeat=”repeat” use_border_color=”off” border_color=”#ffffff” border_style=”solid” global_colors_info=”{}”]
CANVAS
[/et_pb_text][et_pb_text _builder_version=”4.16″ global_colors_info=”{}”]
Our Canvas is an interactive workspace where you can create visual representations of your investigations. Quickly drag-and-drop objects to the Canvas, create and qualify the relationships between them.
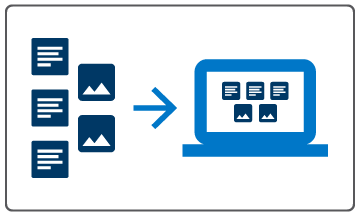
[/et_pb_text][/et_pb_column][/et_pb_row][et_pb_row column_structure=”1_4,3_4″ admin_label=”row” _builder_version=”4.16″ background_size=”initial” background_position=”top_left” background_repeat=”repeat” global_colors_info=”{}”][et_pb_column type=”1_4″ _builder_version=”4.16″ custom_padding=”|||” global_colors_info=”{}” custom_padding__hover=”|||”][et_pb_image src=”https://www.in8development.com/wp-content/uploads/2018/05/EvidenceGraphic.png” align_tablet=”center” align_phone=”” align_last_edited=”on|desktop” _builder_version=”4.16″ animation_style=”slide” animation_direction=”left” animation_duration=”500ms” animation_intensity_slide=”10%” global_colors_info=”{}”][/et_pb_image][/et_pb_column][et_pb_column type=”3_4″ _builder_version=”4.16″ custom_padding=”|||” global_colors_info=”{}” custom_padding__hover=”|||”][et_pb_text admin_label=”Evidence” _builder_version=”4.16″ background_size=”initial” background_position=”top_left” background_repeat=”repeat” use_border_color=”off” border_color=”#ffffff” border_style=”solid” global_colors_info=”{}”]
EVIDENCE
[/et_pb_text][et_pb_text _builder_version=”4.16″ global_colors_info=”{}”]
Quickly import evidence using our intuitive import wizard. Analyze and manage evidence within our application. Easily view evidence files in our Document Viewer. Unique evidence identification numbers are applied to all imported evidence.
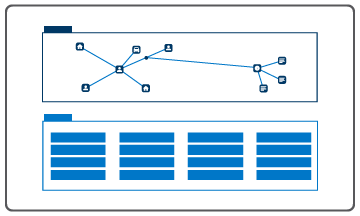
[/et_pb_text][/et_pb_column][/et_pb_row][et_pb_row column_structure=”1_4,3_4″ admin_label=”row” _builder_version=”4.16″ background_size=”initial” background_position=”top_left” background_repeat=”repeat” global_colors_info=”{}”][et_pb_column type=”1_4″ _builder_version=”4.16″ custom_padding=”|||” global_colors_info=”{}” custom_padding__hover=”|||”][et_pb_image src=”https://www.in8development.com/wp-content/uploads/2018/05/TableGraphic.png” align_tablet=”center” align_phone=”” align_last_edited=”on|desktop” _builder_version=”4.16″ animation_style=”slide” animation_direction=”left” animation_duration=”500ms” animation_intensity_slide=”10%” global_colors_info=”{}”][/et_pb_image][/et_pb_column][et_pb_column type=”3_4″ _builder_version=”4.16″ custom_padding=”|||” global_colors_info=”{}” custom_padding__hover=”|||”][et_pb_text admin_label=”Tables” _builder_version=”4.16″ background_size=”initial” background_position=”top_left” background_repeat=”repeat” use_border_color=”off” border_color=”#ffffff” border_style=”solid” global_colors_info=”{}”]
TABLES
[/et_pb_text][et_pb_text admin_label=”Table” _builder_version=”4.16″ background_size=”initial” background_position=”top_left” background_repeat=”repeat” use_border_color=”off” border_color=”#ffffff” border_style=”solid” global_colors_info=”{}”]
Objects added to the Canvas are also viewable in a Table format. Data in the Tables tab can be sorted and filtered. All tables can be exported to Excel for use there.
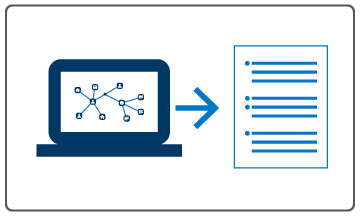
[/et_pb_text][/et_pb_column][/et_pb_row][et_pb_row column_structure=”1_4,3_4″ admin_label=”row” _builder_version=”4.16″ background_size=”initial” background_position=”top_left” background_repeat=”repeat” global_colors_info=”{}”][et_pb_column type=”1_4″ _builder_version=”4.16″ custom_padding=”|||” global_colors_info=”{}” custom_padding__hover=”|||”][et_pb_image src=”https://www.in8development.com/wp-content/uploads/2018/05/ReportsGraphic.png” align_tablet=”center” align_phone=”” align_last_edited=”on|desktop” _builder_version=”4.16″ animation_style=”slide” animation_direction=”left” animation_duration=”500ms” animation_intensity_slide=”10%” global_colors_info=”{}”][/et_pb_image][/et_pb_column][et_pb_column type=”3_4″ _builder_version=”4.16″ custom_padding=”|||” global_colors_info=”{}” custom_padding__hover=”|||”][et_pb_text admin_label=”Reports” _builder_version=”4.16″ background_size=”initial” background_position=”top_left” background_repeat=”repeat” use_border_color=”off” border_color=”#ffffff” border_style=”solid” global_colors_info=”{}”]
REPORTS
[/et_pb_text][et_pb_text _builder_version=”4.16″ global_colors_info=”{}”]
Facts and their supporting evidence can be exported to a linked investigation report. The report includes the fact text, and references to evidence items by their unique identifiers.
[/et_pb_text][/et_pb_column][/et_pb_row][et_pb_row column_structure=”1_4,3_4″ admin_label=”row” _builder_version=”4.16″ background_size=”initial” background_position=”top_left” background_repeat=”repeat” global_colors_info=”{}”][et_pb_column type=”1_4″ _builder_version=”4.16″ custom_padding=”|||” global_colors_info=”{}” custom_padding__hover=”|||”][et_pb_image align_tablet=”center” align_phone=”” align_last_edited=”on|desktop” _builder_version=”4.16″ animation_style=”slide” animation_direction=”left” animation_duration=”500ms” animation_intensity_slide=”10%” animation=”left” sticky=”off” global_colors_info=”{}”][/et_pb_image][/et_pb_column][et_pb_column type=”3_4″ _builder_version=”4.16″ custom_padding=”|||” global_colors_info=”{}” custom_padding__hover=”|||”][et_pb_text admin_label=”Other” _builder_version=”4.16″ background_size=”initial” background_position=”top_left” background_repeat=”repeat” use_border_color=”off” global_colors_info=”{}”]
OTHER FUNCTIONALITY
[/et_pb_text][et_pb_text _builder_version=”4.18.0″ hover_enabled=”0″ global_colors_info=”{}” sticky_enabled=”0″]
Create multiple workspaces. Export your Canvas to PDF. Move and dock panels and multiple monitor functionality. Advanced integrations allow for automatic de-conflict and query, both by the user and by enterprise data scientists and analysts.
[/et_pb_text][/et_pb_column][/et_pb_row][/et_pb_section]